You have 0 items in your cart
Key Takeaways
- Recruitment KPIs show what is working and what is slowing hiring down.
- A focused KPI set keeps attention on quality, speed, cost, and candidate experience.
- Clear definitions and consistent tracking prevent reporting from turning into guesswork.
- KPI dashboards become useful when they guide weekly decisions on bottlenecks and follow-up.
- A recruitment ATS & CRM supports KPI tracking by keeping workflow data and reporting in one place.
Hiring performance becomes clear when it is measured the same way, every week. In 2026, recruitment KPIs turn hiring outcomes into numbers that can be tracked, compared, and improved with confidence.
This guide defines recruitment KPIs, then breaks down 10 KPIs to track in 2026. It also explains how a recruitment KPI dashboard fits inside a recruitment ATS & CRM so bottlenecks show up early, priorities stay focused, and changes can be measured against a baseline.
What are recruitment KPIs and why do they matter in 2026
Recruitment KPIs are measurable metrics that show how well the hiring process performs across quality, speed, cost, and candidate experience. They work when the team agrees on definitions, tracks them the same way, and reviews them on a set cadence.

KPIs are only useful when they drive decisions. The right KPI in recruitment tells a recruiter or a hiring manager exactly what to fix next, such as a slow interview stage, a weak sourcing channel, or an offer process that loses candidates late.
Top 10 recruitment KPIs to track in 2026
These recruitment KPI examples are the baseline for staffing teams that want consistent results. The goal is not to track everything. The goal is to track the indicators that tighten the funnel, improve placement outcomes, and make performance easier to explain to clients.
Hiring teams are also raising the expectation for measurable work. AIHR’s overview of recruiting metrics shows that 82% of companies believe data is critical to drive talent acquisition decisions, which means KPI tracking needs consistency, not more reporting.
Recruitment KPI formulas: What to track and what to watch for
| KPI | Formula | Watch for |
|---|---|---|
| Quality of hire (QoH) | QoH score = (performance score + retention score + hiring manager satisfaction score) / 3 | QoH has no universal standard. Set the inputs once, document the scoring, and keep it consistent across desks and accounts. |
| First-year attrition or early turnover | Early turnover rate (%) = (new hires who left within X months / total hires in the same cohort) x 100 | Define the time window, then track by client and role family. A single cohort can hide major differences across accounts. |
| Time to fill and time to hire | Time to fill (days) = offer accepted date – requisition approved date
Time to hire (days) = offer accepted date – candidate entry date |
Segment by role type, desk, and client. A single blended average hides where delays happen. |
| Cost per hire (CPH) | Cost per hire = (internal recruiting costs + external recruiting costs) / number of hires | Do not treat it as a standalone score. Review it alongside quality of hire and speed. |
| Candidate experience or candidate NPS (cNPS) | cNPS = % promoters – % detractors | Use a consistent survey point and minimum sample size. Do not overreact to a small number of responses. |
| Offer acceptance rate (OAR) | Offer acceptance rate (%) = (offers accepted / offers extended) x 100 | Track by client, role type, and location. Drops signal a mismatch in pay, scope, or process speed. |
| Candidate drop-off or application completion rate | Stage drop off rate (%) = (candidates who exit a stage/candidates who enter that stage) x 100
Optional: |
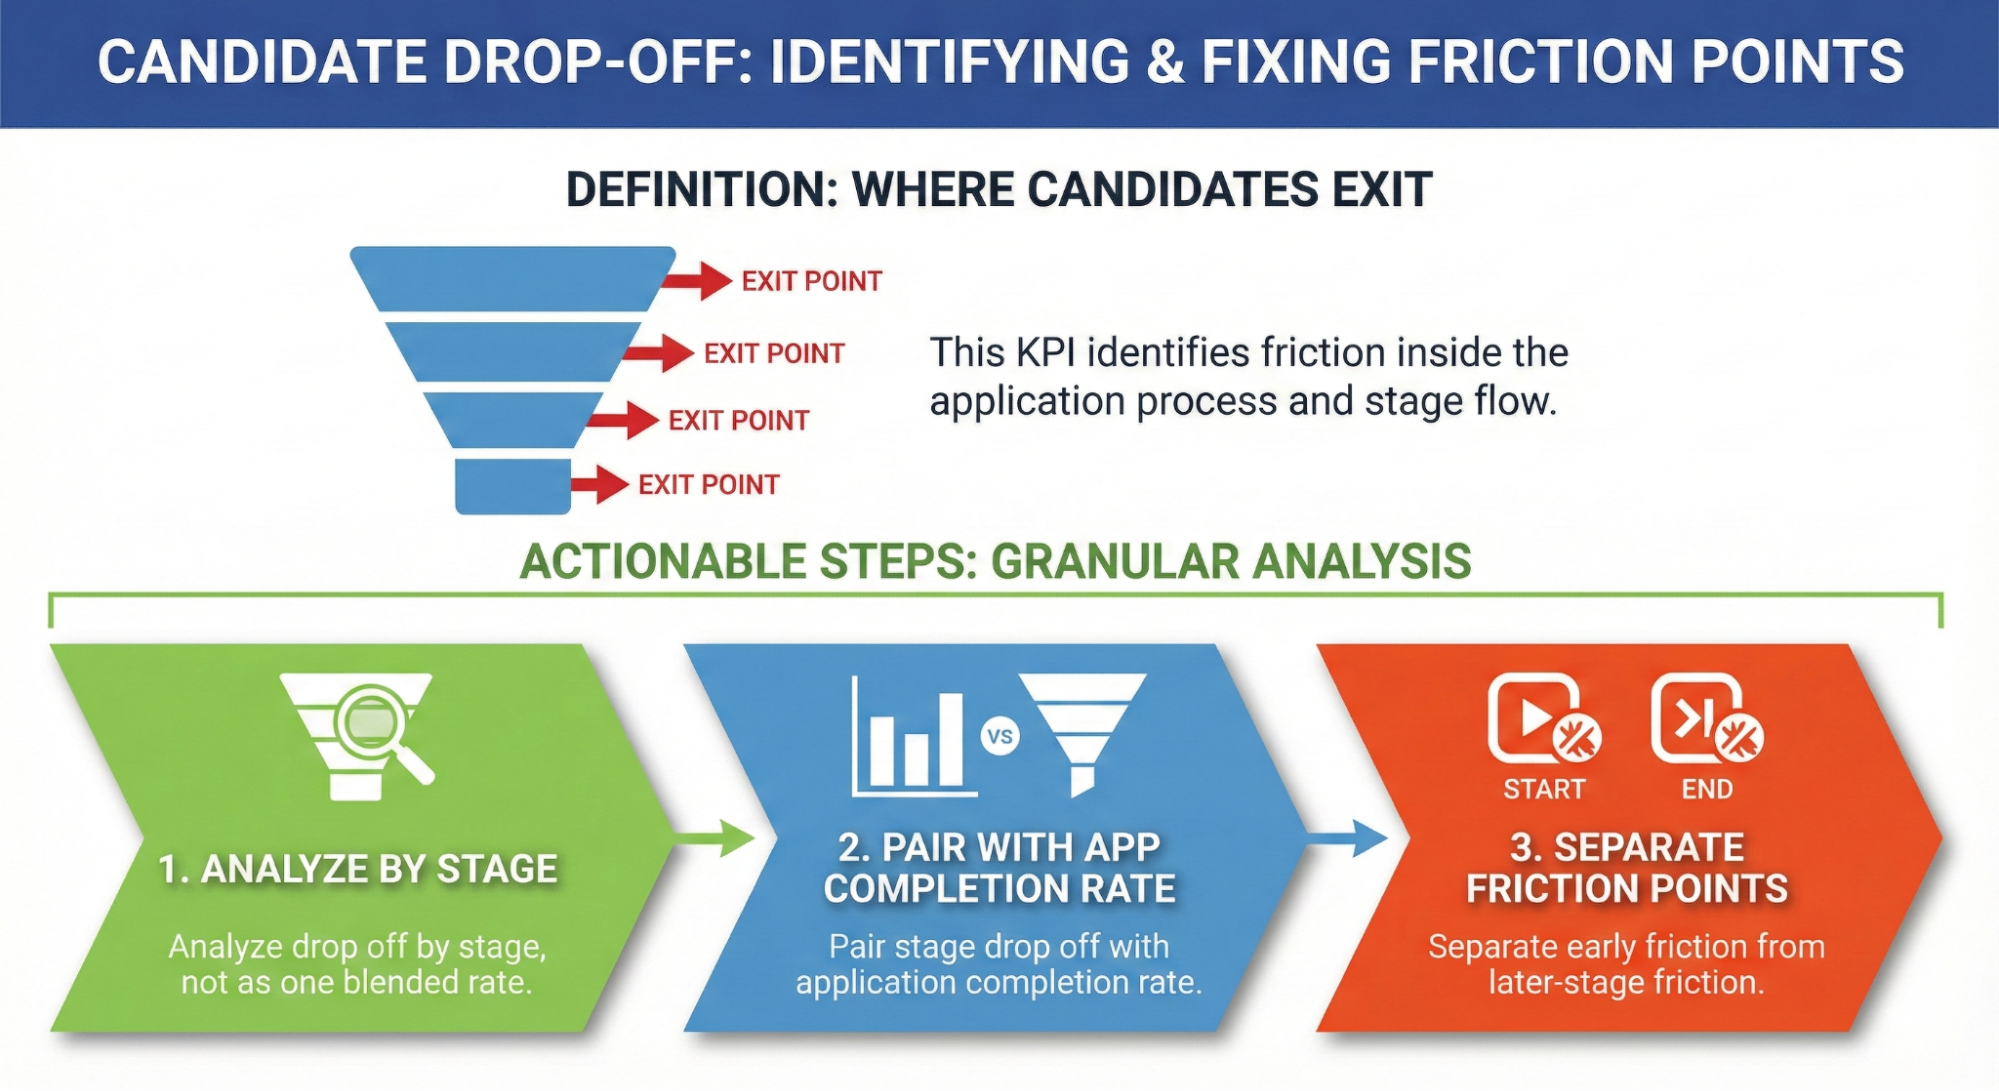
Pinpoint the exact stage where drop off spikes. Fix workflow friction before adding more screening. |
| Sourcing channel effectiveness or source quality | Source of hire (%) = (hires from a source / total hires) x 100
Qualified rate by source (%) = (qualified candidates from source / total candidates from source) x 100 |
Source tagging must be accurate. Compare sources by quality and conversion, not raw applicant volume. |
| Recruiter productivity | Hires per recruiter = total hires/number of recruiters (per month or quarter) | Productivity needs context. Desk type, role difficulty, and support tools change output. |
| Recruitment automation or technology impact | Hours saved per hire = baseline manual hours per hire – current manual hours per hire
Optional: |
Measure outcomes, not tool usage. If automation does not improve speed, conversion, or data quality, it is not working. |
1. Quality of hire (QoH)
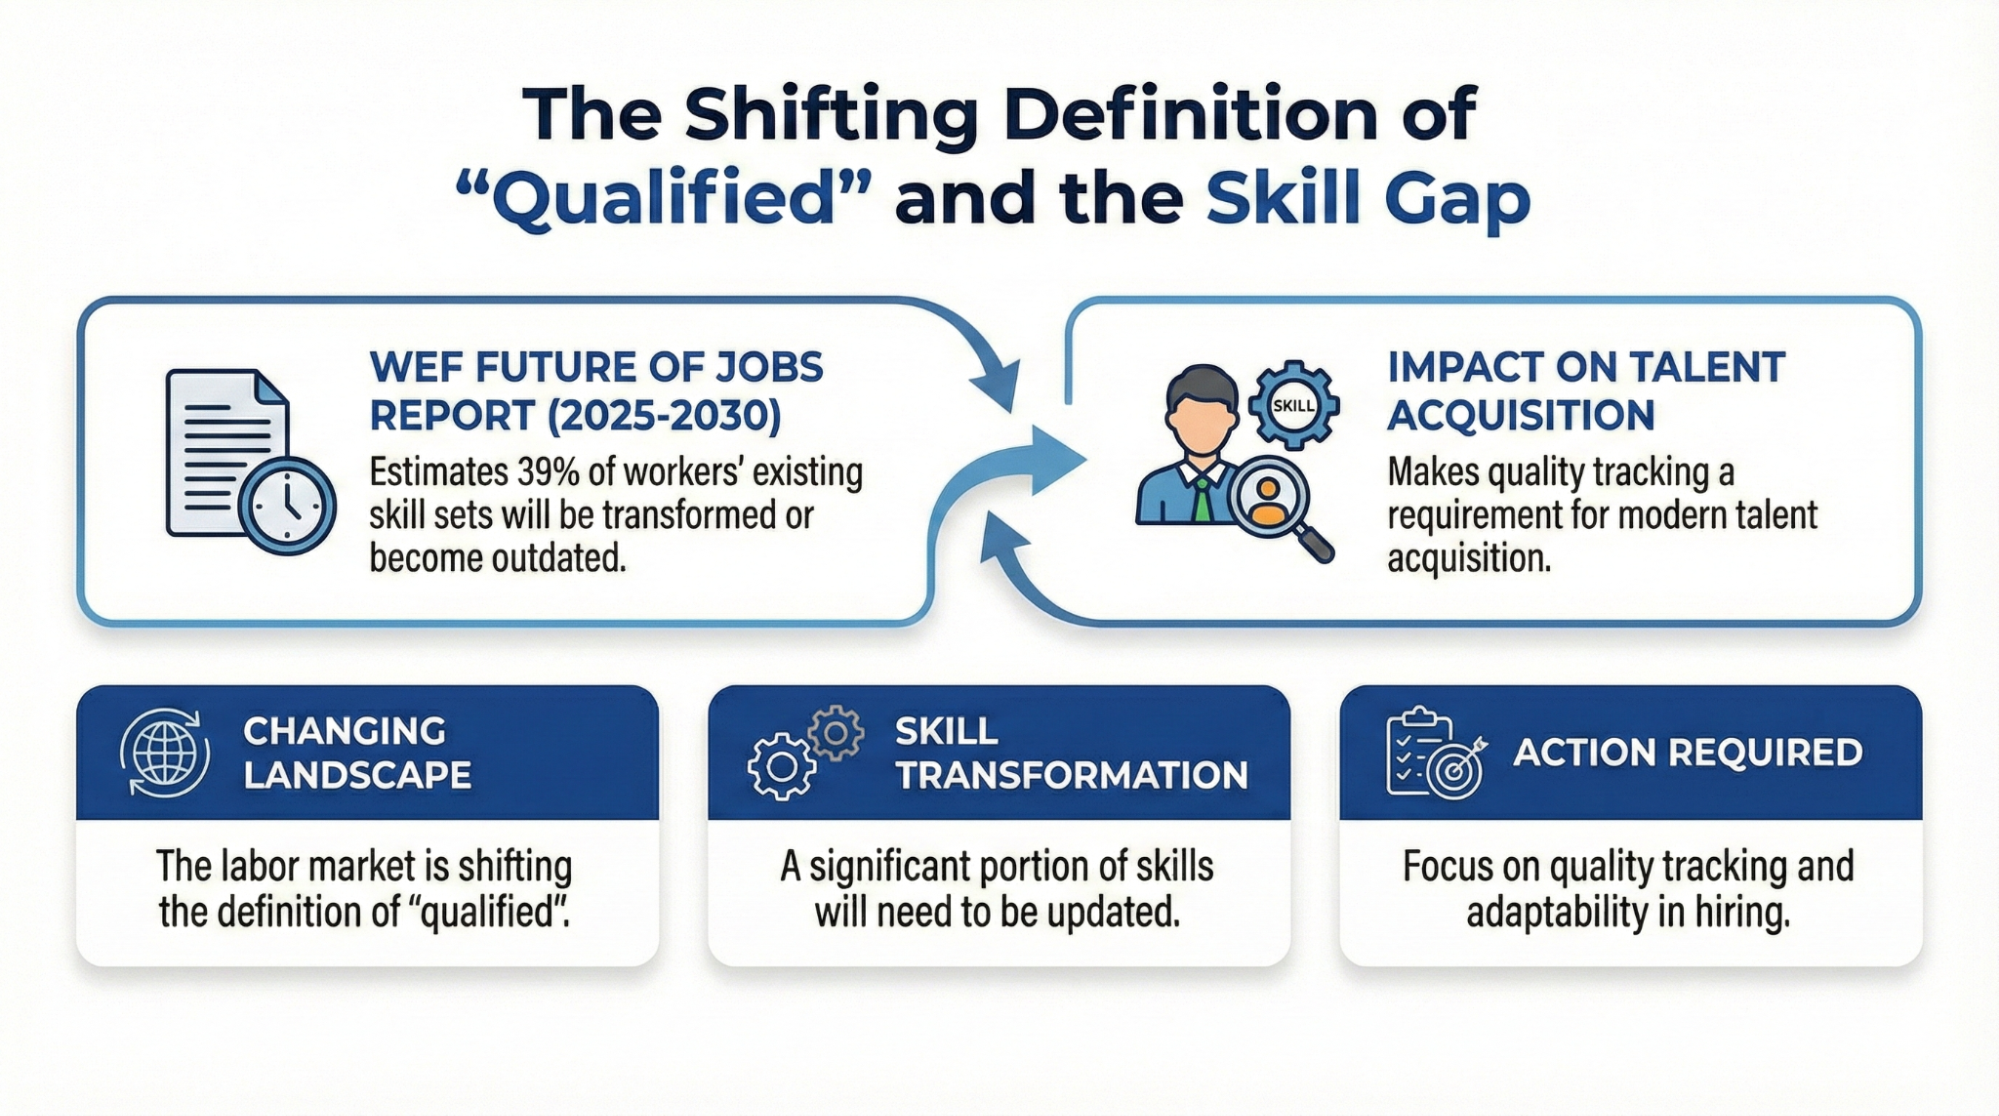
Quality of hire measures whether a placement performs and stays, not just whether a role gets filled. This KPI protects staffing teams from “fast but wrong” hiring.
Make QoH practical by using one consistent scorecard across performance, retention, and hiring manager satisfaction. Review it by client and role family, so the signal stays clear and coaching stays specific.
The labor market is also shifting the definition of “qualified.” The World Economic Forum’s Future of Jobs Report for 2025 estimates 39% of workers’ existing skill sets will be transformed or become outdated over 2025–2030, which makes quality tracking a requirement for modern talent acquisition.
2. First-year attrition or early turnover
Early turnover tracks how many new hires leave within a defined window. This KPI exposes misalignment in role scope, expectations, and post-offer handoff.
Use early turnover trends to tighten intake, improve screening, and set expectations earlier in the process. Track it by client and role family, then review the roles that churn most to identify what is consistent and fixable.
3. Time to fill and time to hire
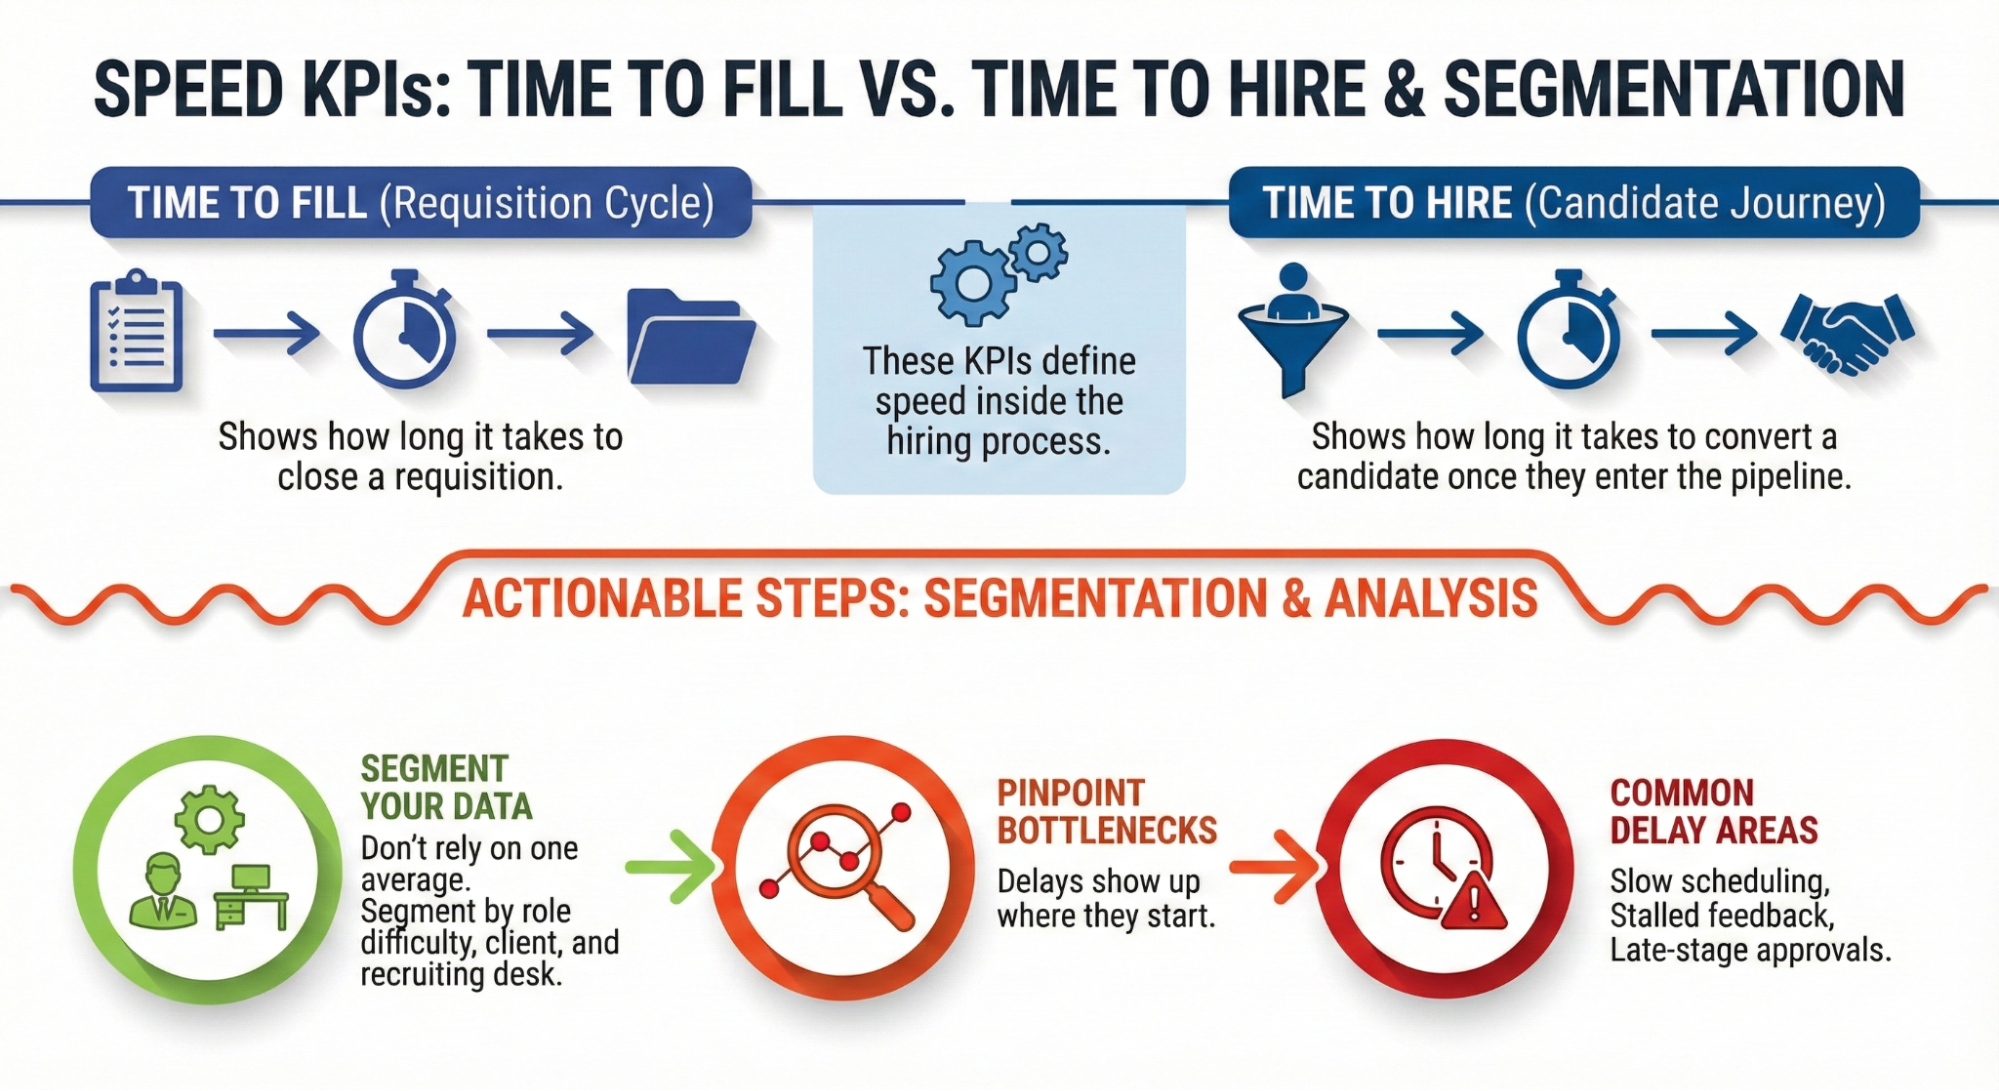
Time to fill shows how long it takes to close a requisition. Time to hire shows how long it takes to convert a candidate once they enter the pipeline. These KPIs define speed inside the hiring process.
Do not rely on one average. Segment by role difficulty, client, and recruiting desk so delays show up where they start, such as slow scheduling, stalled feedback, or late-stage approvals.
For market context, the BLS Job Openings and Labor Turnover Summary (JOLTS) reports job openings unchanged at 7.7 million in October 2025, which reinforces that speed remains a competitive advantage in 2026 hiring.
4. Cost per hire (CPH)
Cost per hire measures the total recruiting cost required to deliver hires in a period. CPH protects margin and forces clarity on which spend produces outcomes.
Treat cost per hire as a performance tradeoff, not a target in isolation. Review it alongside quality of hire and time to hire so the team can see whether cost is buying quality, buying speed, or funding wasted activity.
5. Candidate experience or candidate NPS (cNPS)
Candidate experience measures how candidates feel about the process they went through. It drives conversion because candidates drop out when the process feels slow, unclear, or inconsistent.
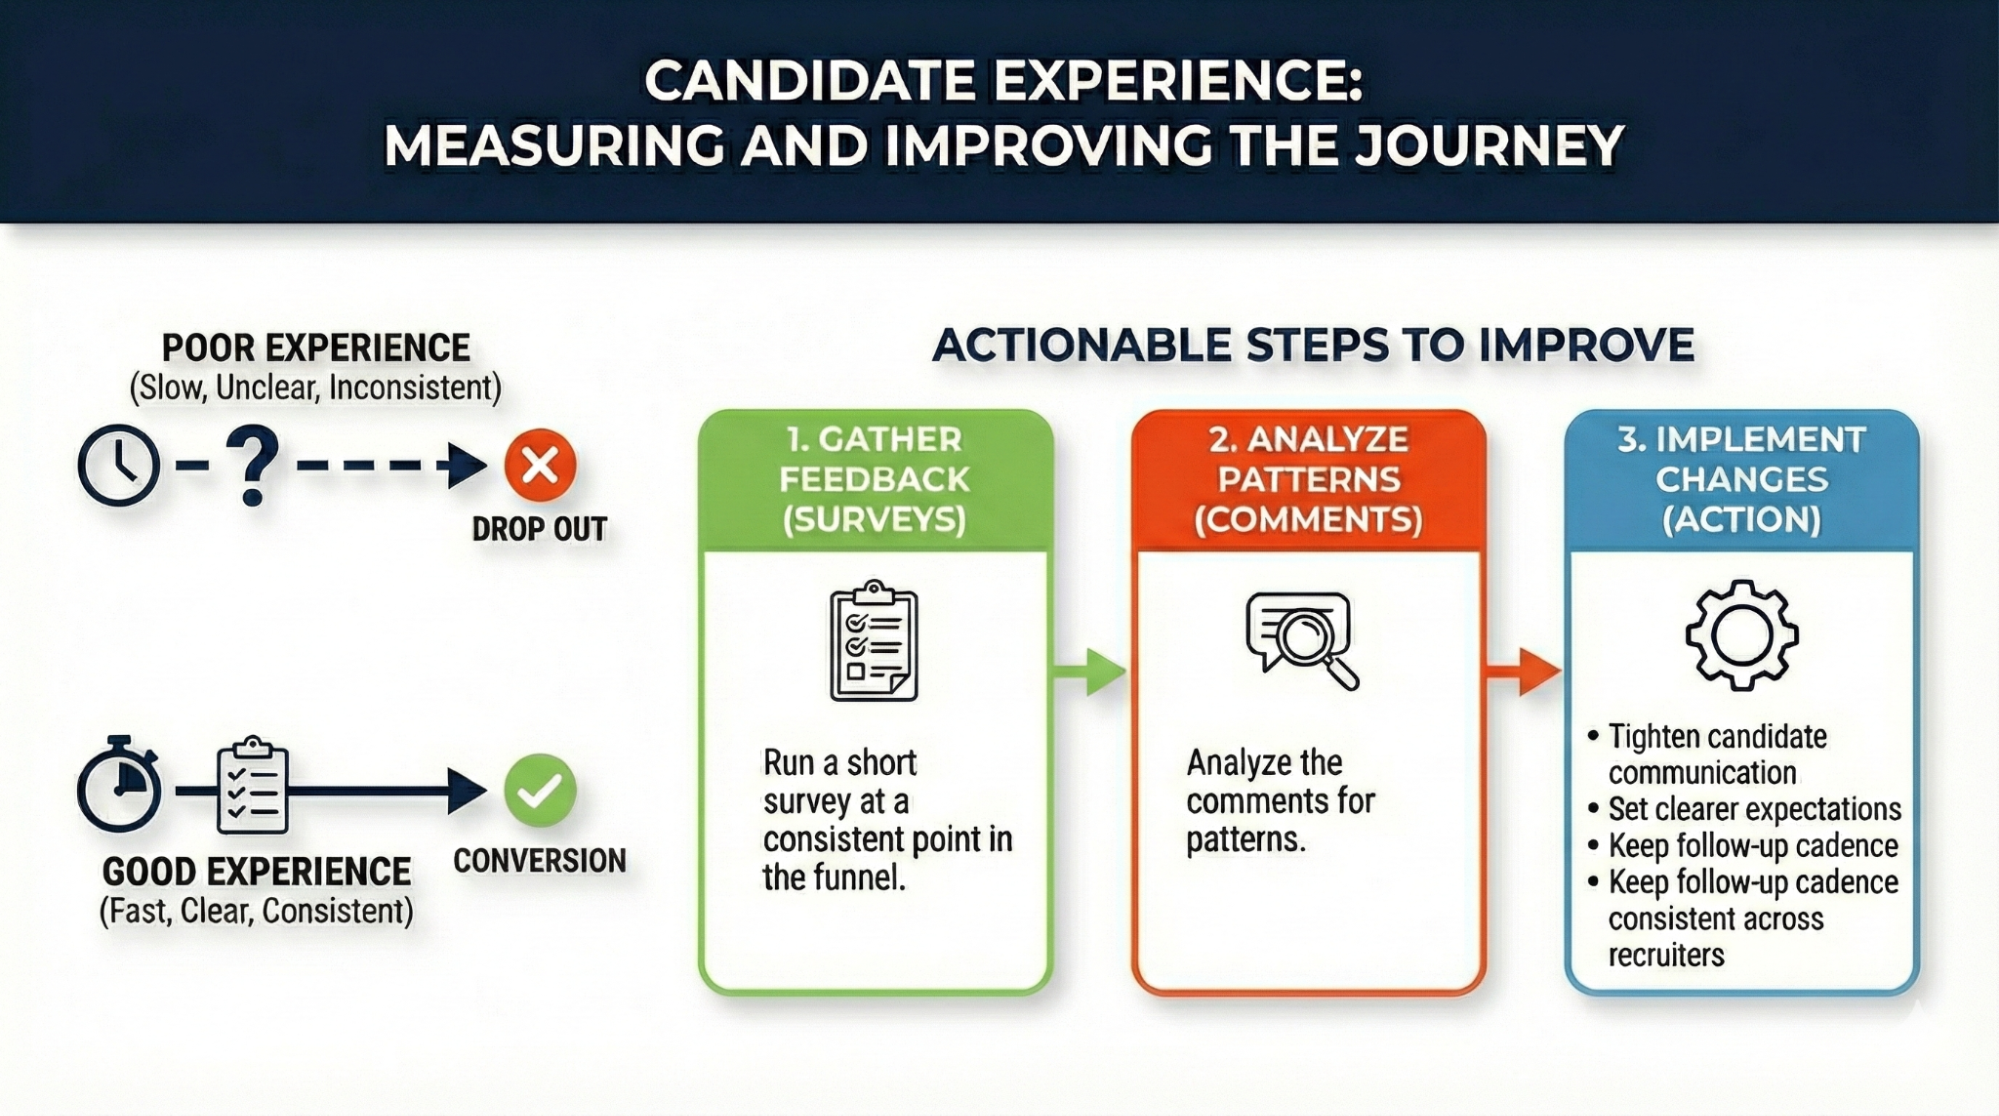
Run a short survey at a consistent point in the funnel, then analyze the comments for patterns. Use candidate feedback to tighten candidate communication, set clearer expectations, and keep follow-up cadence consistent across recruiters.
6. Offer acceptance rate (OAR)
Offer acceptance rate measures how often offers convert into starts. This protects recruiters’ time because late-stage declines waste weeks of effort and reset the client timeline.
Track offer acceptance rate by client, role type, and location. When it drops, treat it as a process diagnosis and review compensation alignment, decision speed, role clarity, and candidate expectation setting.
7. Candidate drop-off or application completion rate
Candidate drop-off measures where candidates exit the funnel. This KPI identifies friction inside the application process and stage flow.
Use productivity to identify where recruiters lose time, such as admin work, duplicated outreach, or inconsistent process steps. Set expectations with context based on role difficulty, client pace, and support resources.
8. Sourcing channel effectiveness or source quality
Sourcing effectiveness measures which channels produce hires and qualified candidates. It stops teams from chasing volume when the real goal is conversion and quality.
Compare job boards, referrals, pooled candidates, and direct sourcing by qualified rate and stage conversion. Keep the source of hire tagging consistent across recruiters so the data reflects reality, not guesswork.
Skills demand is also changing fast, which makes source quality more important than source volume for 2026 hiring.
9. Recruiter productivity
Recruiter productivity measures output per recruiter over a defined period. This supports capacity planning and helps leaders see whether the recruiting team is constrained by workload, workflow, or tools.

Use productivity to identify where recruiters lose time, such as admin work, duplicated outreach, or inconsistent process steps. Set expectations with context based on role difficulty, client pace, and support resources.
10. Recruitment automation or technology impact
Automation impact measures whether technology improves speed, conversion, or hours saved. This KPI keeps automation accountable to outcomes, not feature adoption.
Deloitte’s Human Capital Trends states that leaders need better ways to recognize and measure value as tools shift from automation to augmentation. In recruiting, that starts with baselines and ends with measurable change in funnel performance.
Advanced recruitment KPIs to layer in later
These are supporting recruitment metrics teams add after the core 10 are stable and tracked consistently.
- Time in process per stage or days to offer: Diagnose bottlenecks in complex or high-value roles.
- Time to productivity: connect hiring quality and onboarding outcomes by tracking ramp-up speed.
- Hiring manager satisfaction score: Measure stakeholder experience and identify process gaps after roles close.
- Internal mobility rate: Show how many roles are filled from within existing talent, and pair it with redeployment rate and time to redeploy tracking for teams that place contractors and repeat candidates.
- Fill rate or vacancy fill ratio: Measure how many open roles actually close within the period.
- Cost of vacancy: Quantify the financial impact of slow hiring for leadership discussions.
- Skills-based hiring metrics: Track progress toward skills-first hiring instead of relying on credentials alone.
Building a recruitment KPIs dashboard with Tracker
A recruitment KPI dashboard turns recruiting activity into measurable outcomes inside one system. Tracker ATS & CRM centralizes candidate, job, and activity data so staffing teams can run recruitment analytics and act on what the numbers show.
KPI tracking improves fastest when teams standardize core workflows, especially the ATS workflows that fix delays in speed, collaboration, and consistency.
- Reporting and dashboards: Build KPI dashboard views using dashboards, custom reporting, KPI, and lifecycle reporting, and Big Screens for team visibility. Add user targets so recruiter productivity is measured against benchmarks, not just raw counts.
- Recruitment ATS & CRM: Track pipeline movement through customizable workflows, job management, resume parsing, searching, and shortlist actions. Use built-in data management tools like dead record finder, incomplete record finder, and non-communication finder to keep reporting accurate.
- Automation: Improve speed and consistency with sequences and workflow automation, plus tools like Auto Match, Watchdogs, Auto Parse, and Auto Engage. Measure impact through cycle time and conversion change.

- Collaboration: Reduce time in stage with client portal access, video interviews, and video resumes so feedback is easier to capture and decisions move faster.

- Back office and onboarding: Support later-stage tracking through advanced KPIs like time to productivity and compliance completion.

Turning recruitment KPIs into everyday habits
Recruitment KPIs only matter when they change what the team does every week. Staffing teams that improve results in 2026 use a focused KPI set across quality, speed, cost, and experience, then fix the stage that is hurting conversion.
Pick 3 to 5 KPIs to focus on this quarter, make the dashboard visible, and review the same numbers every week. Use the review to assign one workflow fix per KPI, then measure whether the change improved the next week’s results.
Turn these recruitment KPIs into real progress for your team with Tracker’s Recruitment ATS & CRM.
Book a demo to see the KPI dashboards, reporting, and workflows built for staffing firms.
FAQs
How do recruitment KPIs relate to overall business goals?
Recruitment KPIs connect recruiting work to business outcomes like speed, retention, stakeholder experience, and cost control. When KPIs tie to those outcomes, teams prioritize work that improves results instead of chasing activity.
How do quality of hire KPIs impact long-term talent retention?
Quality of hire KPIs measure fit and early performance signals that predict whether a placement will hold. When staffing teams track quality of hire alongside early turnover, they tighten intake, screening, and expectation setting, which improves retention over time.