Recruitment Analytics & Reporting Software
Every desk, every consultant, every placement. In plain sight.
Tracker makes all of your data visible, including the trends that would have stayed hidden, so you can explain where things stand without disappearing into Excel.
How it works
The data that runs your business, in plain sight
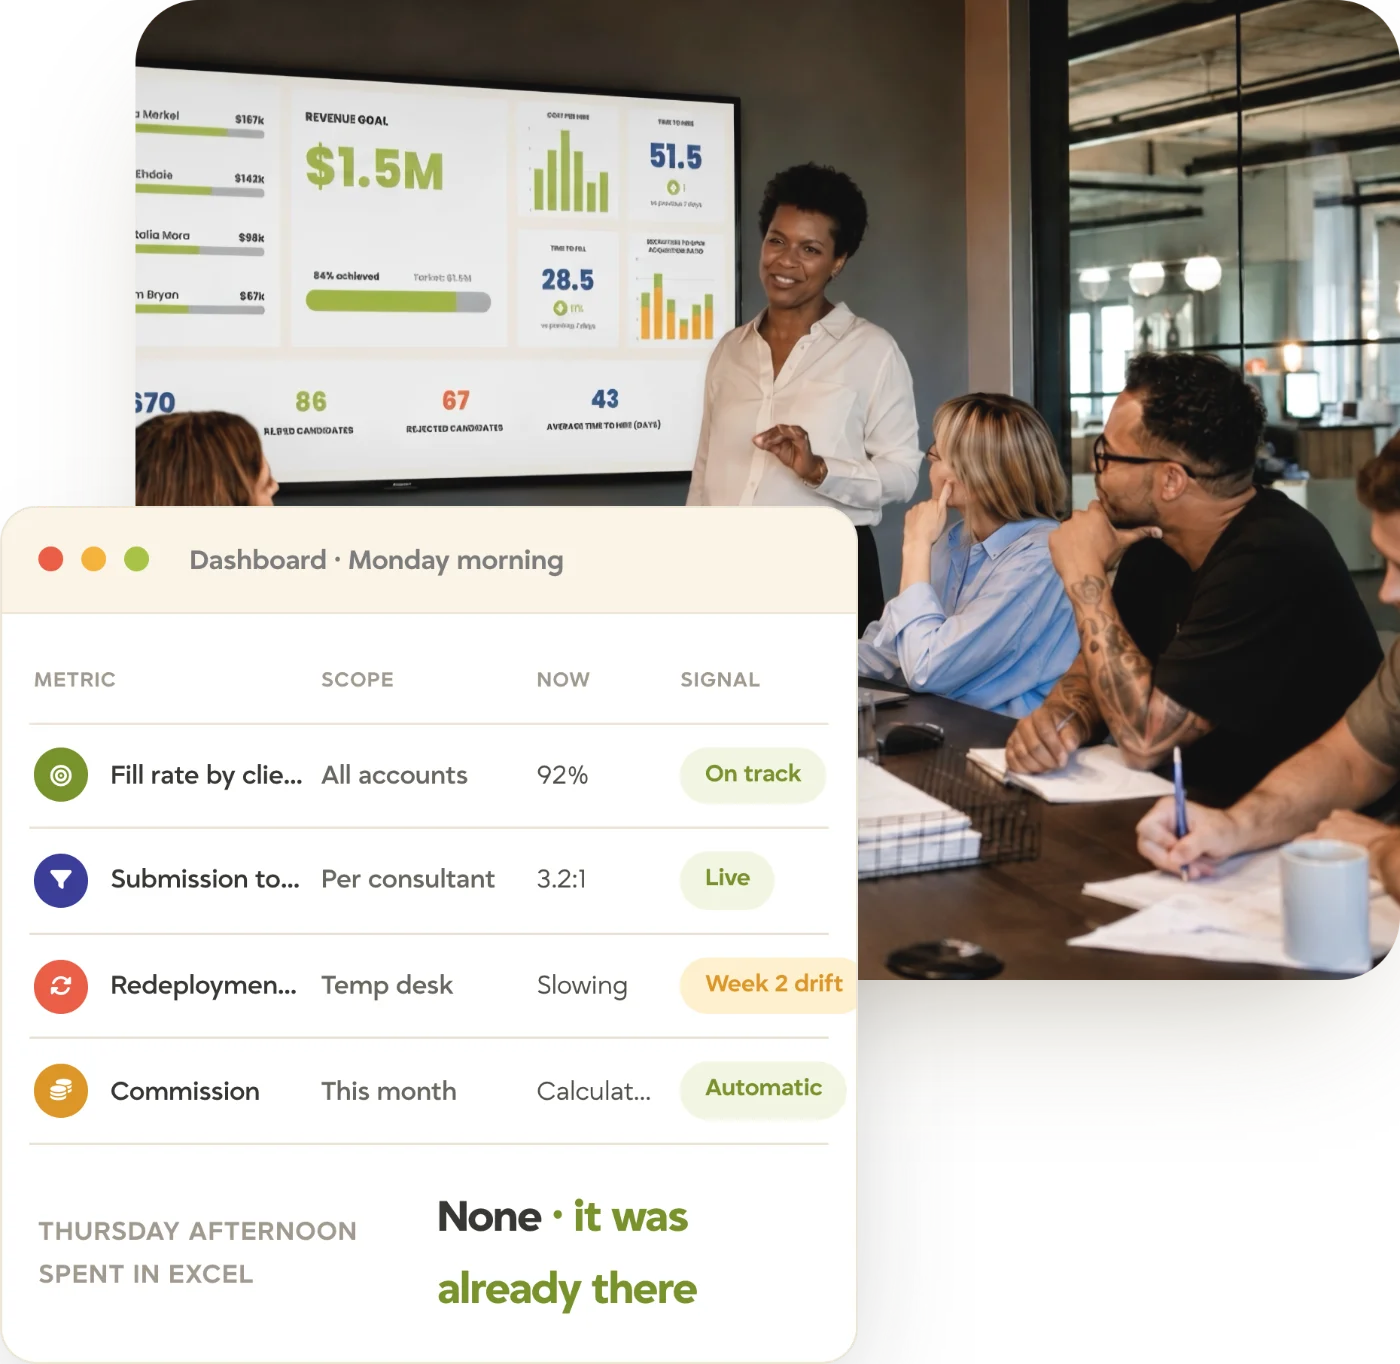
The numbers are all there. They just aren’t visible, at least not without someone spending Thursday afternoon in Excel pulling them together for Friday’s meeting. Tracker makes them visible three ways.
Already there
Dashboards
A library of ready-made data views, fill rates, pipeline health, margin, time-to-fill, assembled into dashboards without anyone building them from scratch. The MD walks into Monday already knowing where things stand.
50+ widgets, unlimited dashboards
Built however you want
Custom reports
Any field in Tracker, in summary, matrix or trend format. Build it once and it runs itself, delivered to the right inboxes on the schedule you set. Delivered however often you want it.
Excel, CSV, PDF or PNG
Surfaces what’s hidden
Lifecycle & predictive
Quantity, Quality and Velocity at the same time, across the full funnel, with predictive analytics that flag the drift in week two, not week eight. Coaching, not surveillance.
From CV send to placement
Placements, margin, client activity and compliance all sit on the same record, so a question about how the business is performing has one answer, not three exports that have to be reconciled by hand.
Dashboards · Big Screen · Targets
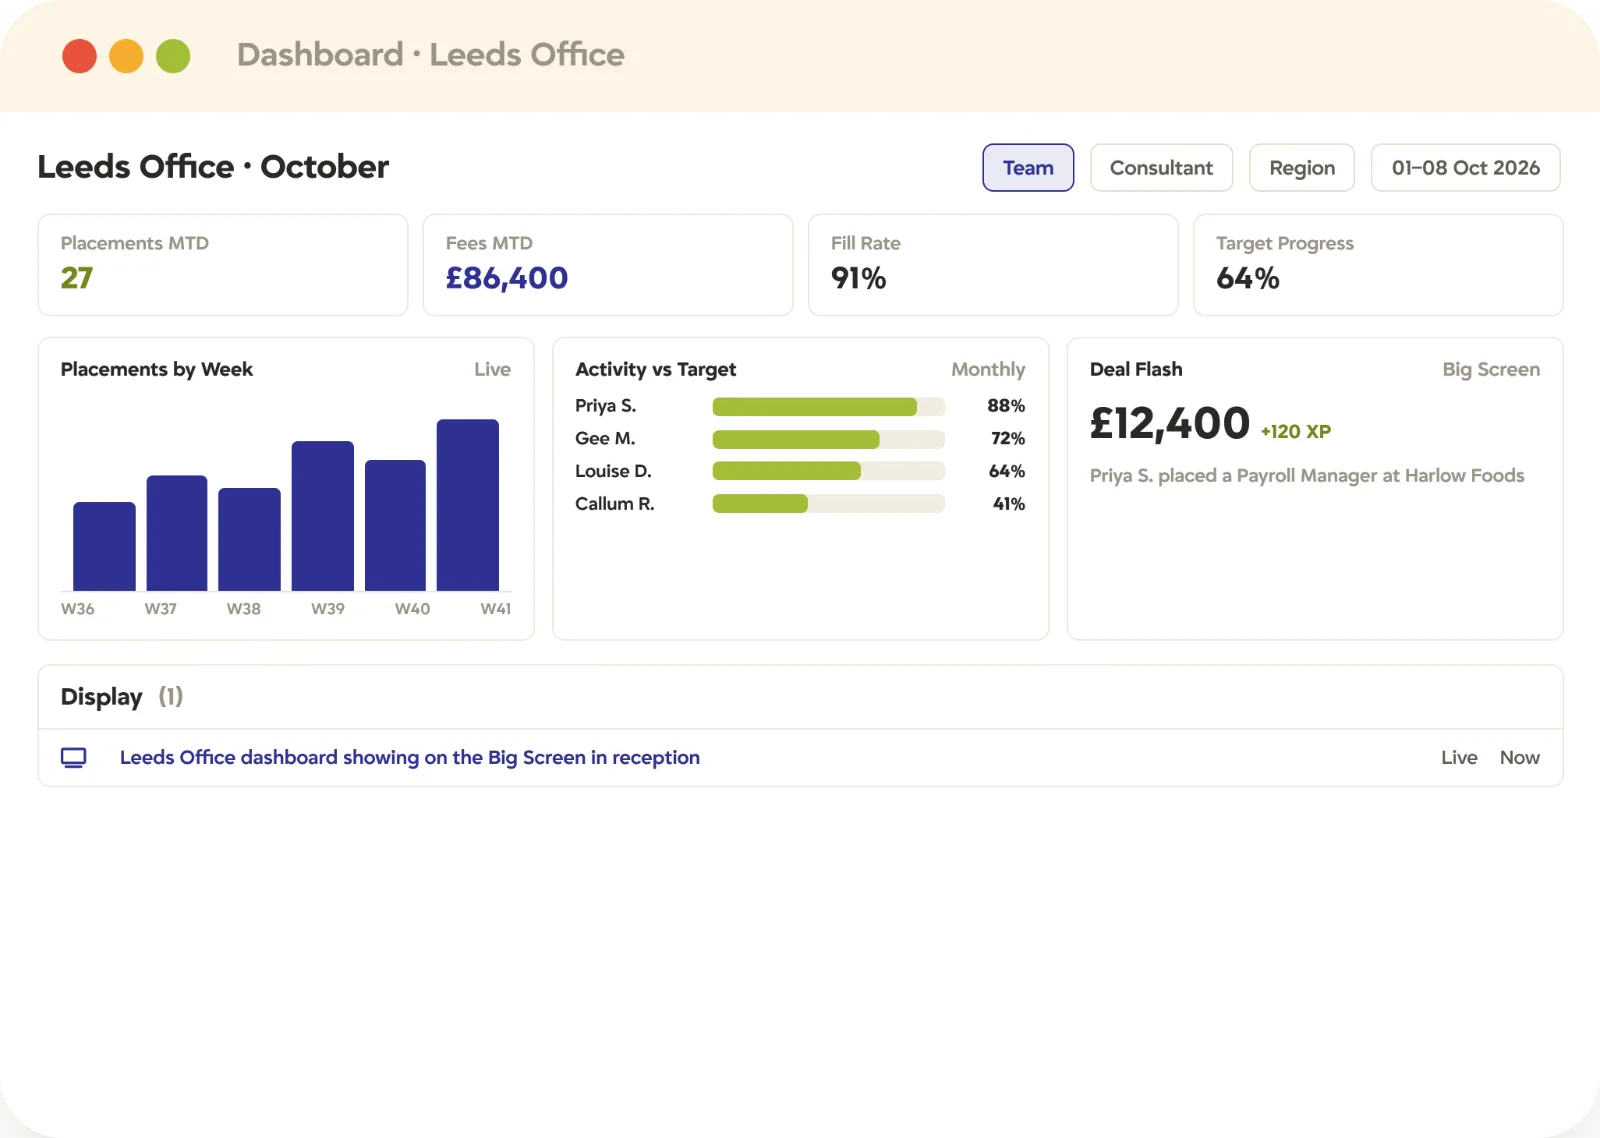
See exactly where the business stands, without anyone having to compile it
Organized and visible, so you already know where things stand: before the board meeting, before the client calls, before Monday starts.
Unlimited dashboards built from a library of 50+ standard widgets, KPIs and custom reports. Nobody builds them from scratch.
Smart filtering by individual, team, department, date range or geo-location. Every desk, every consultant, every placement.
Live data, current from the moment the work happens. The dashboards that don’t get buried in a tab.
Big Screen dashboards beamed to office walls in real time. With gamification: Deal Flash and XP points for milestones.
User targets at financial and activity level, tracked monthly with historic comparison. The KPI that tracks against where you’re trying to go.
Matters most to Managing directors & branch heads
Custom reports · Scheduled delivery · Report2Excel
Built however you want. Delivered however often you want it.
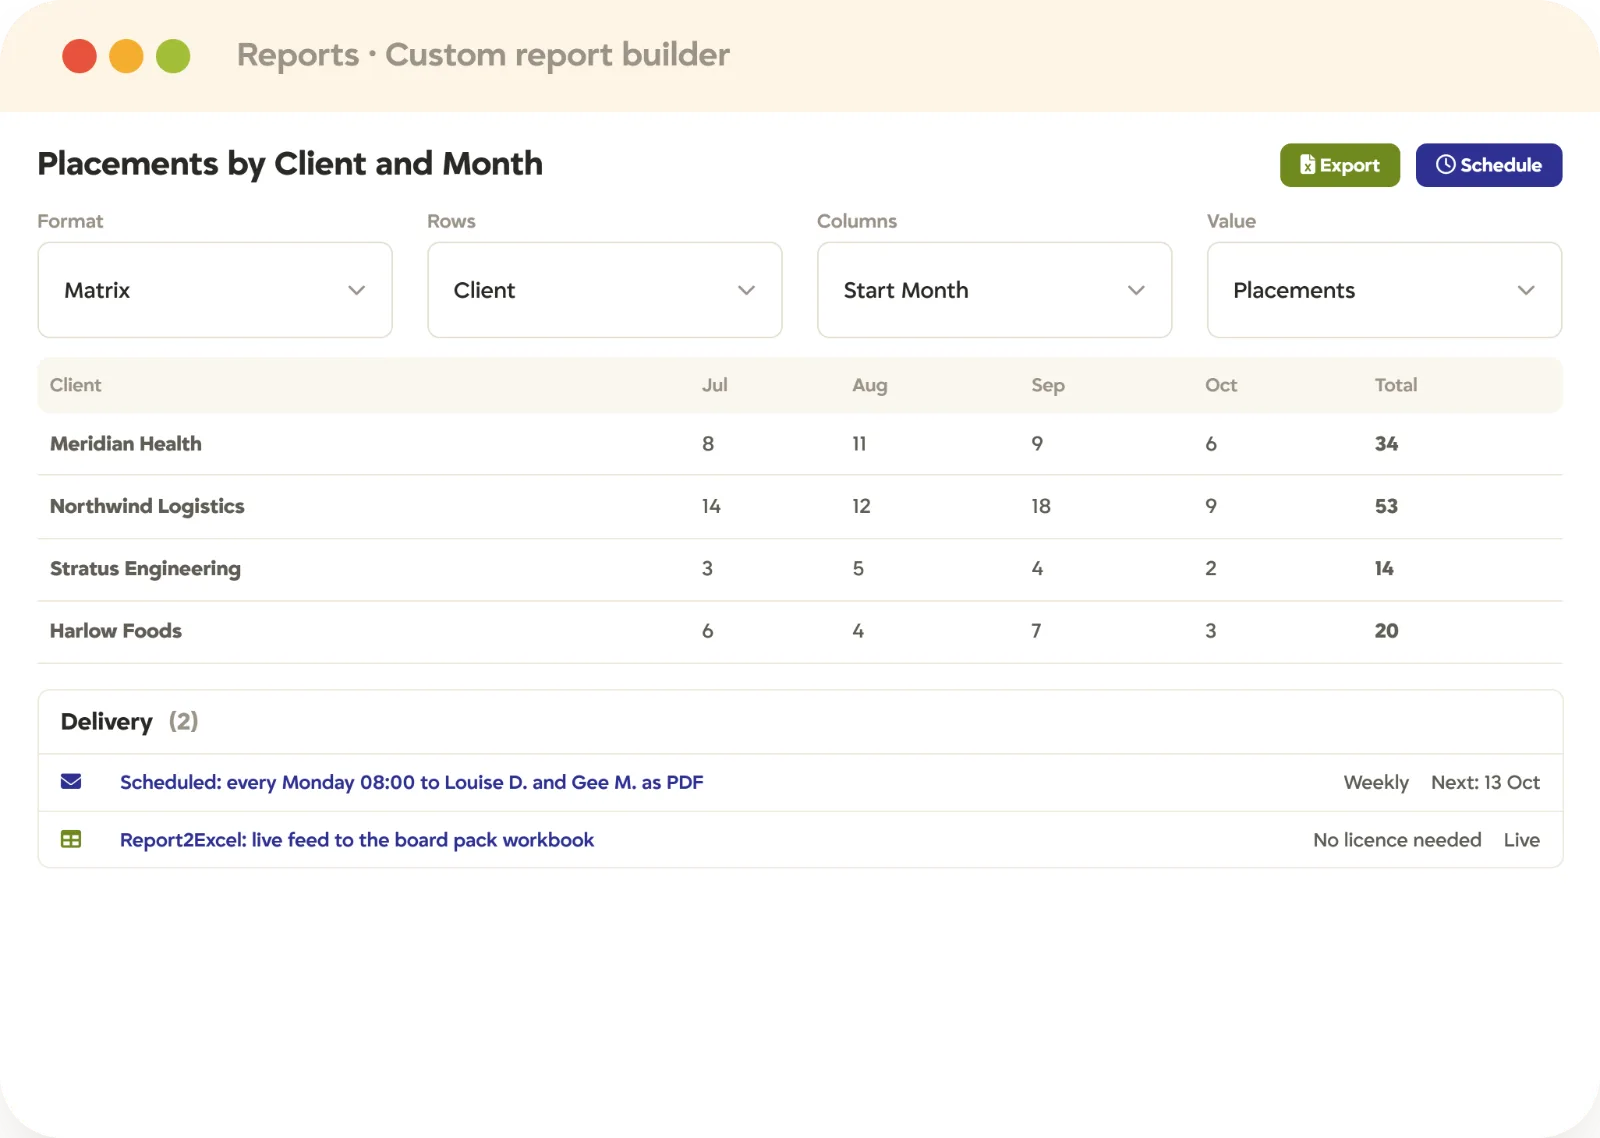
The report the old system couldn’t give, built once from any field and running itself from then on. Friday morning’s report wasn’t compiled Thursday afternoon. It was already there.
Custom report builder using any field in Tracker, in summary, matrix and trend formats. Any grouping, any comparison.
Export to Excel, CSV, PDF or PNG. Straight into a board pack.
Scheduled delivery, daily, weekly or monthly, to any team member’s inbox. Or any client’s.
Report2Excel feeds live data directly into Microsoft Excel, no Tracker licence required. For board reporting, client scorecards and finance reconciliation.
Matters most to Finance directors & operations
Natural Language Reporting · TrackerAI · Pre-built prompts
Ask the question you actually have. Tracker builds the report.
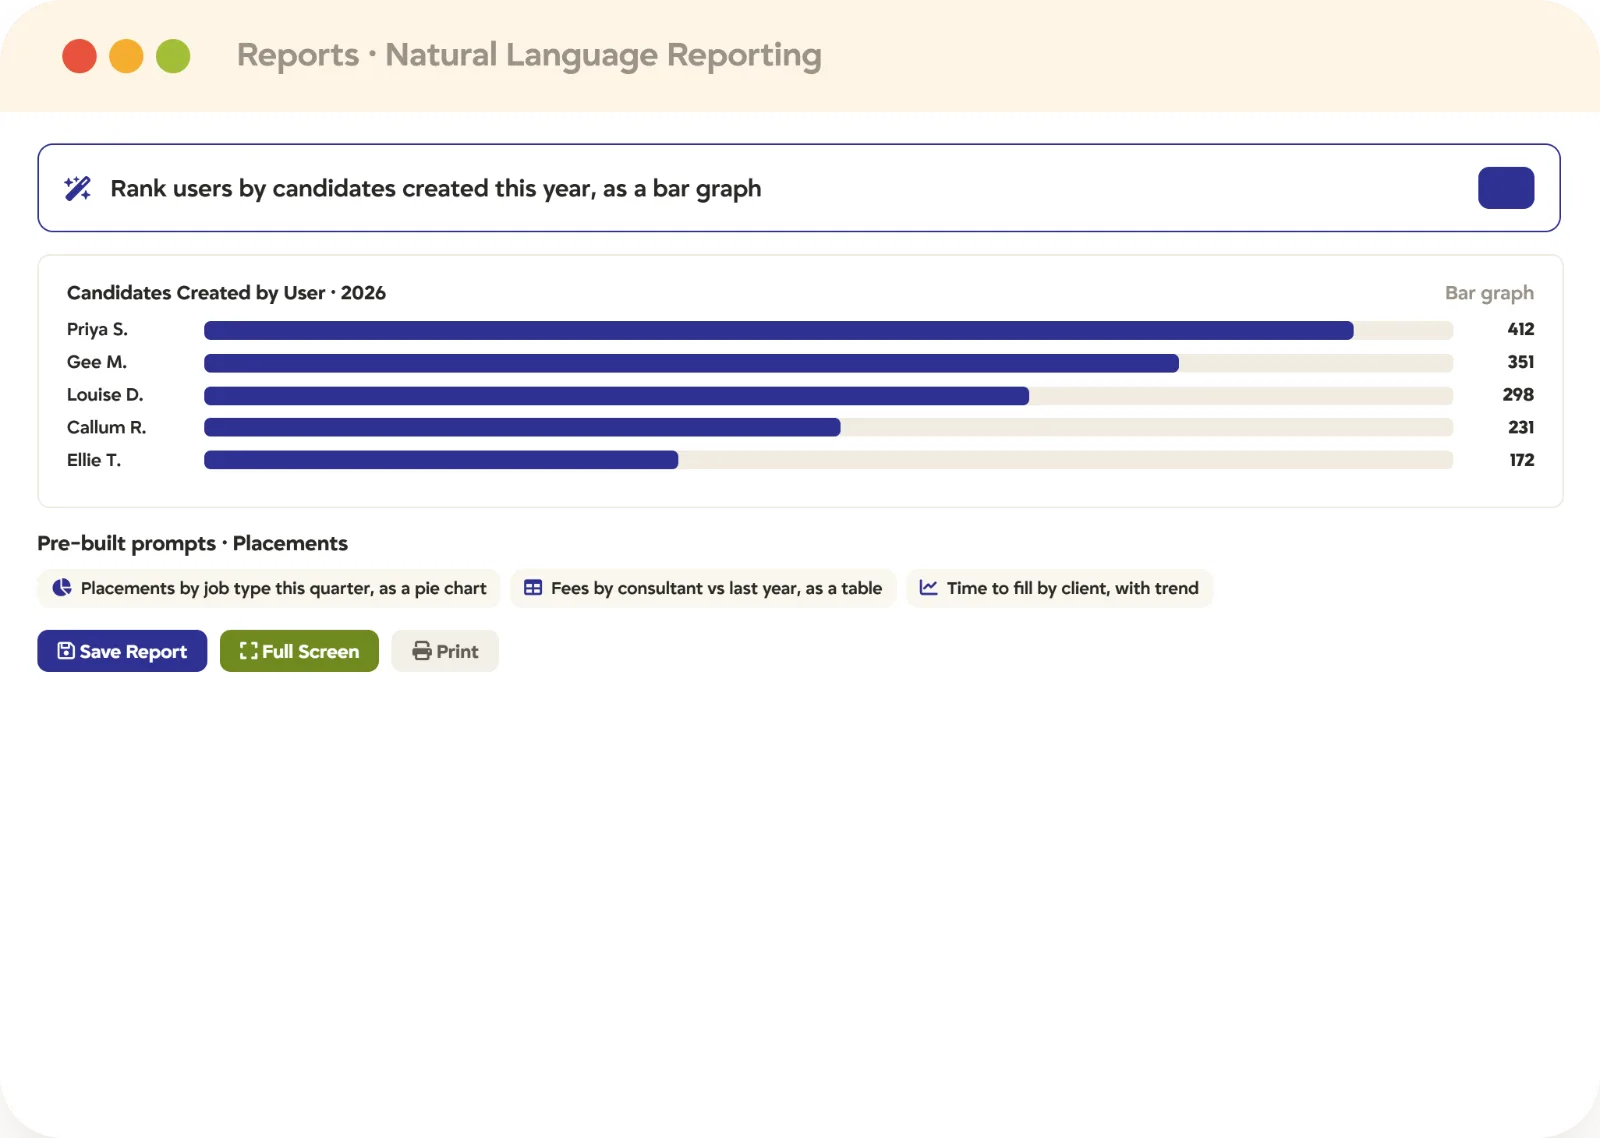
Type what you want in plain English, the way you’d ask a colleague, and the report builds live. No report-building screens, no filters to configure in advance, no waiting on someone else to pull it for you.
Works across jobs, candidates, placements, companies, activities, marketing, financials, timesheets and users. All reachable from one prompt box.
Combine a time period, a person, a status and a comparison in one prompt, typed or dictated. If you can describe it, you can ask for it.
Say how you want it shown: bar graph, pie chart or table with trends. “Rank users by candidates created this year, show as pie chart.”
Pre-built prompts by report area and report view, each explaining what it reports and how. Nobody needs to know how the data is modelled.
Refine by editing the prompt, then keep it with the same save options as any report. View full screen, print or download, and it’s there next time.
Matters most to Every desk, no specialist needed
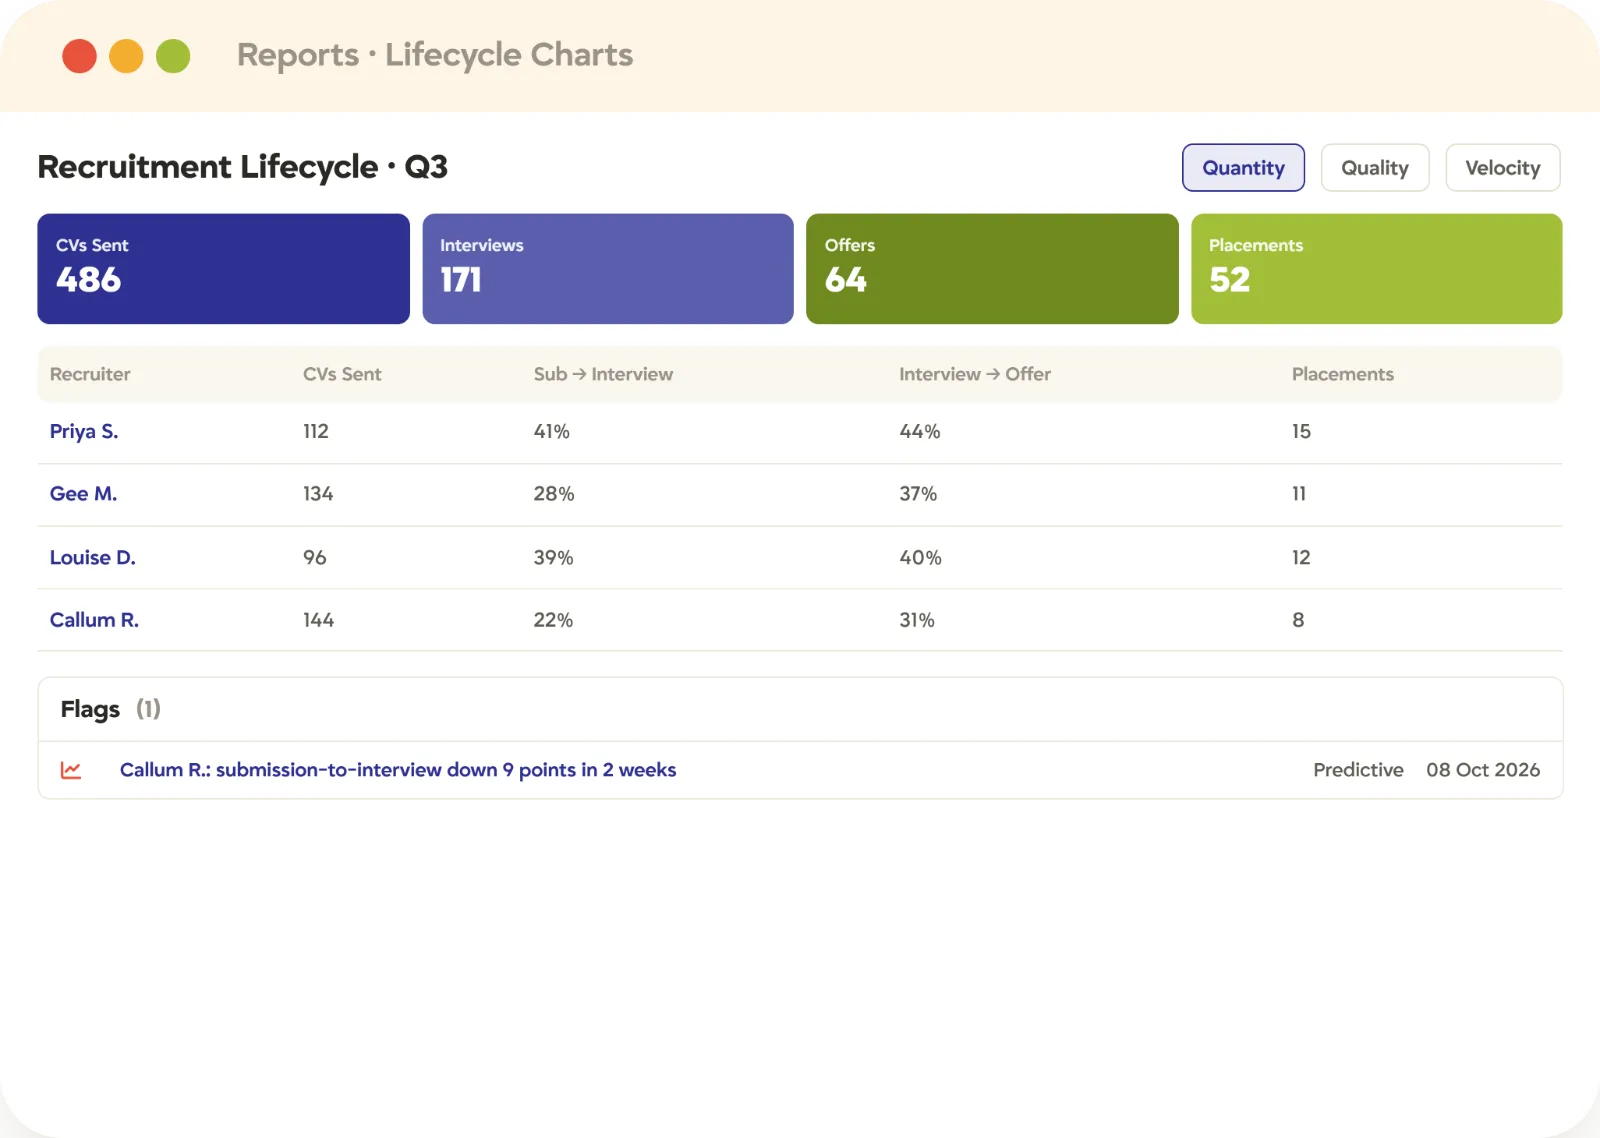
Lifecycle Charts · Conversion rates · Predictive analytics
Busy isn’t the same as productive. Lifecycle Charts show the difference.
Quantity tells you who’s working. Quality tells you who’s placing. Velocity tells you how fast. Tracker shows all three at once, so the conversation becomes “you’re losing people at interview, let’s work on that”, not “send more CVs”.
Quantity, Quality and Velocity across the full funnel, from CV send to interview to placement. The number, the rate and the trend at the same time.
Submission-to-interview and interview-to-offer ratios for every recruiter. Know who’s converting, not just who’s busy.
Predictive analytics flag problems before they surface. The drift in week two, not week eight.
Both sides of a split desk in one funnel: roles won, candidates submitted, interviews booked, placements made. See where momentum is lost instead of guessing which half to push.
Matters most to Team leaders
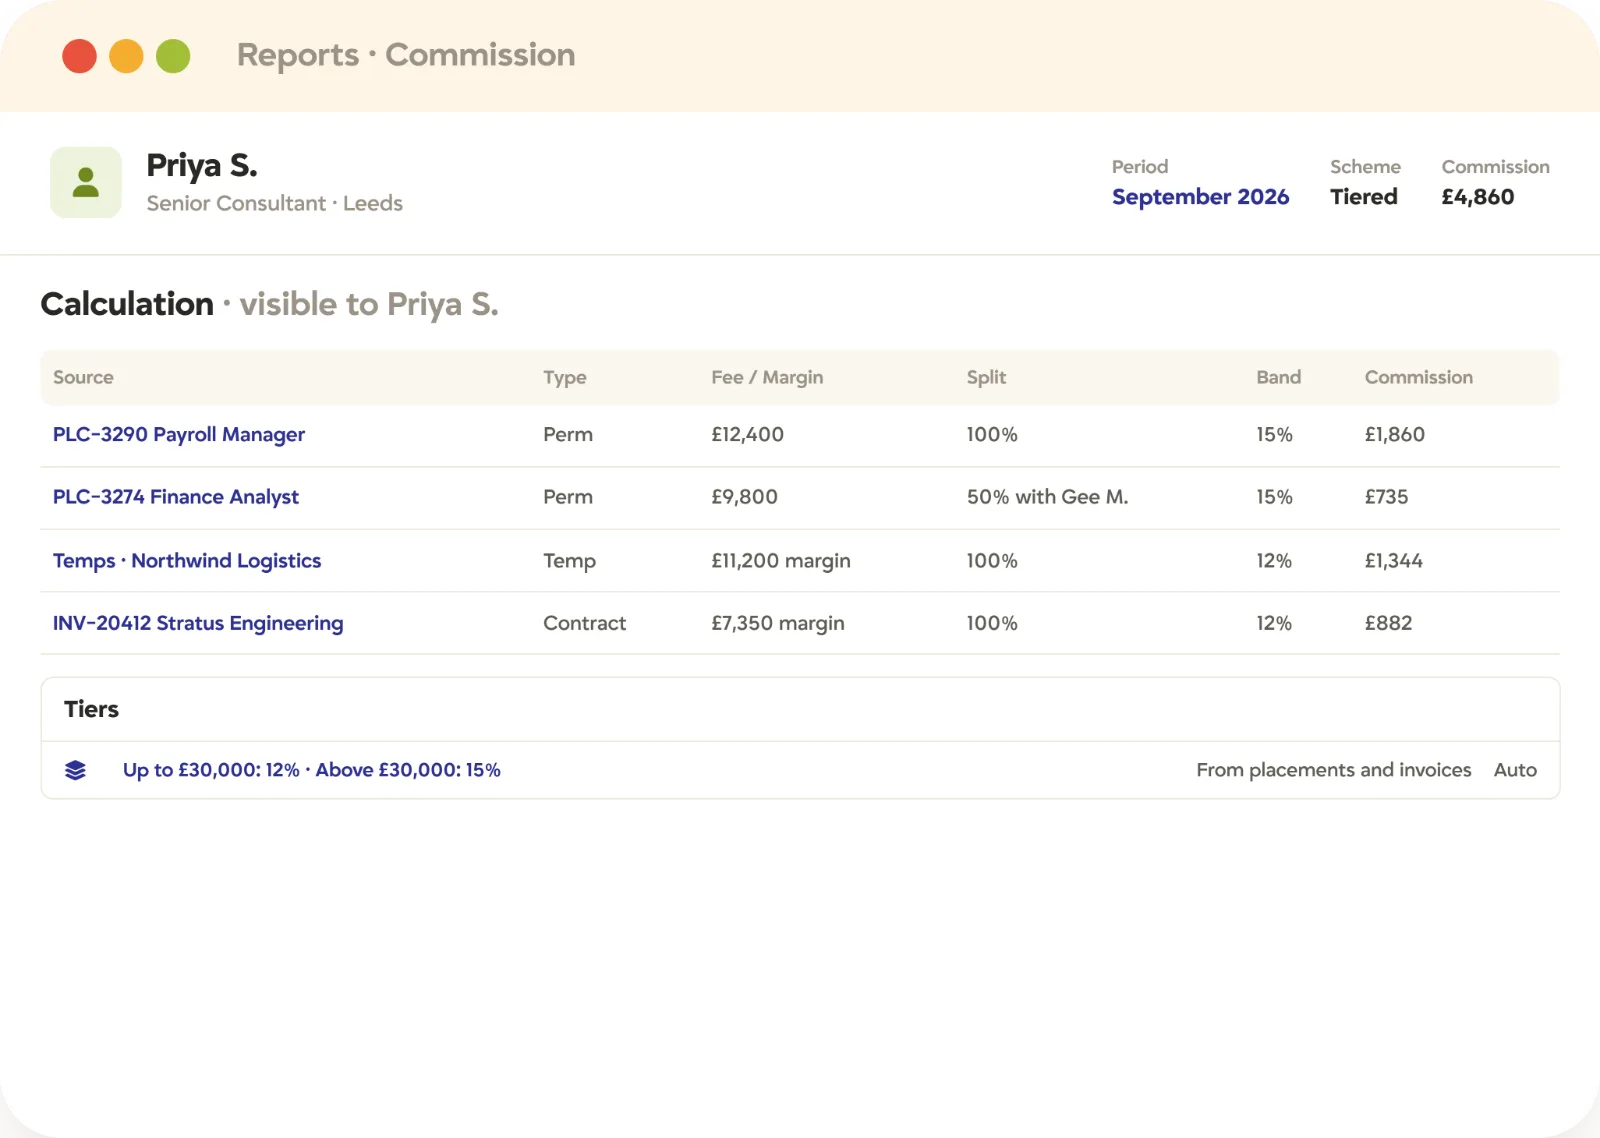
Commission reporting · Tiered banding · Consultant view
Commission with the math attached
Commission calculated in a spreadsheet gets disputed every month. Calculated from actual placement and invoice data, there’s nothing left to dispute.
Automatic calculation across jobs, placements, temps and invoices. No spreadsheet, no month-end disappearing act.
Flat or tiered banding. Splits, bands, perm, temp: whatever your setup, Tracker does the math.
Consultants can see the calculation behind their own number. The commission your consultants can see for themselves.
Pulled from the same records as placements and invoicing. No manual reconciliation.
Matters most to Finance directors & consultants
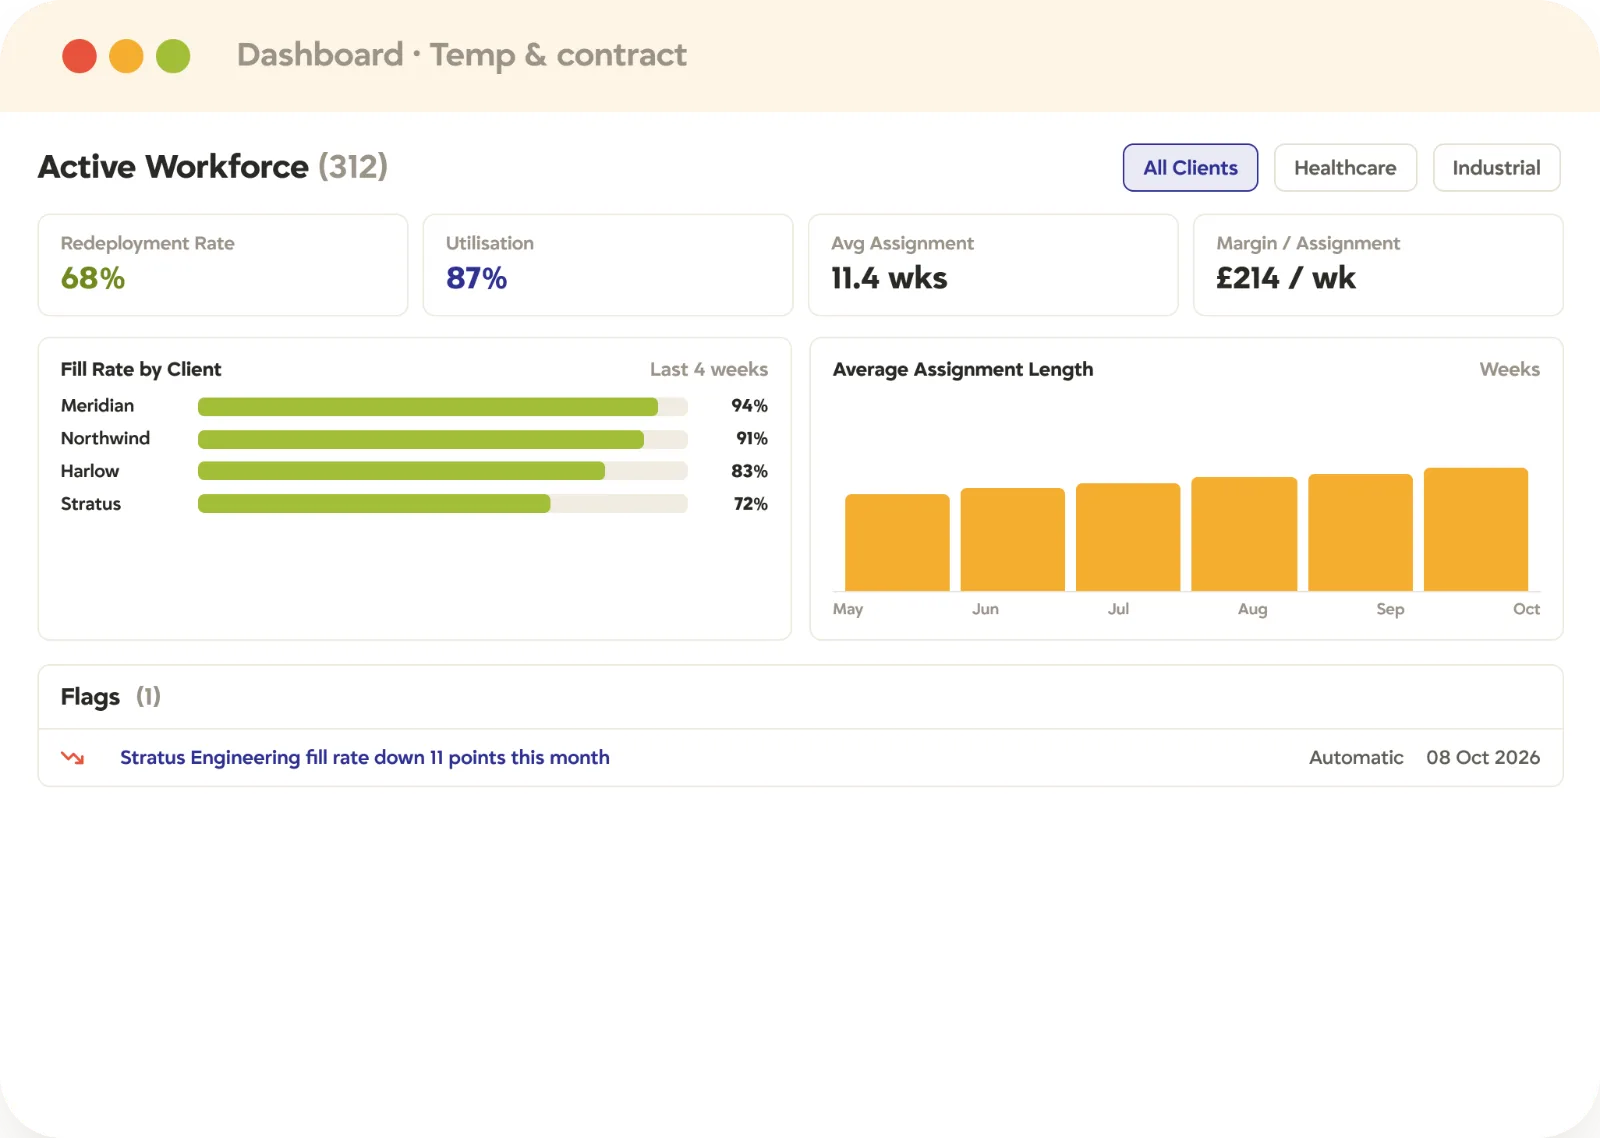
Temp & contract analytics · Redeployment · Fill rate
Three hundred workers, one dashboard, zero spreadsheets
Busy isn’t the same as efficient. The metrics a high-volume desk runs on, finally in plain sight, so redeployment slowing in week two gets acted on before the revenue leaks away.
Redeployment rate and worker utilization, in real time. Are workers moving between assignments, or sitting idle?
Average assignment length, trending up or down. Across the whole active workforce.
Fill rate by client. Catch drift before it costs an account.
Margin per active assignment. Straight from back office data.
Matters most to Operations managers
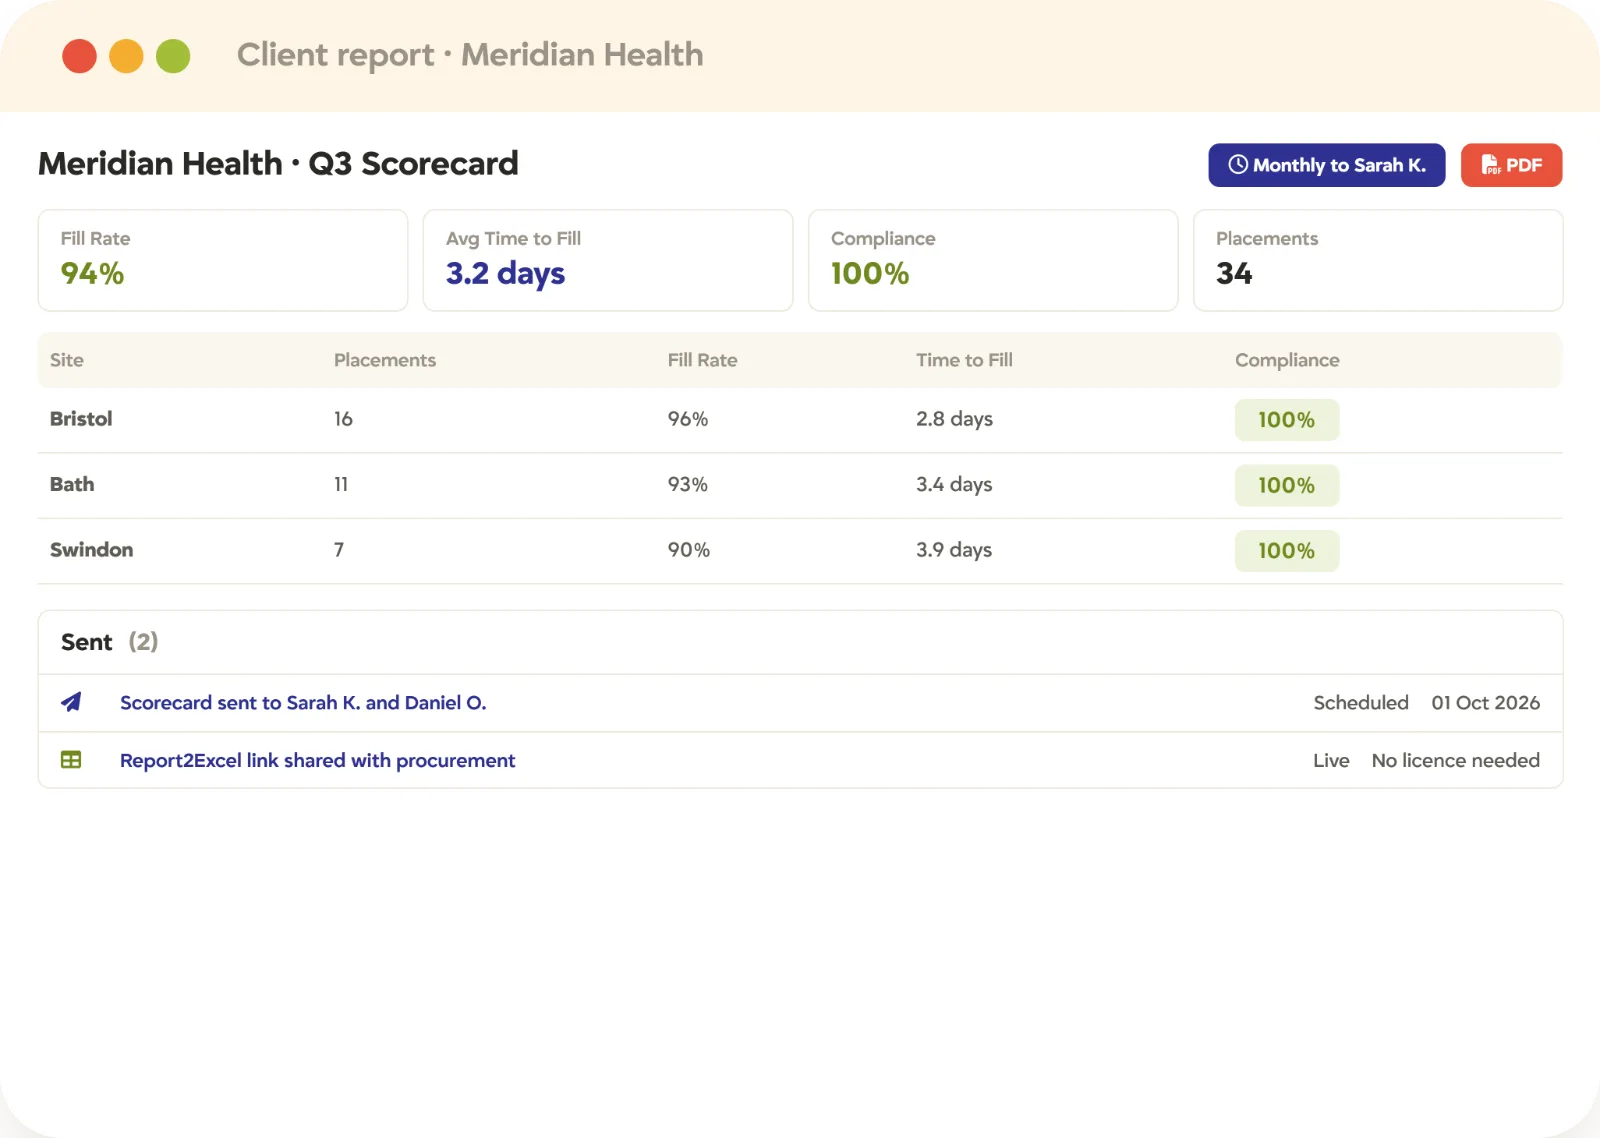
Client reports · Scorecards · Report2Excel
The client review that used to take a day to prepare
Managed service and high-volume temp clients expect a regular performance report. The agency that delivers it cleanly looks like the partner worth renewing.
Branded, client-ready reports and scorecards. Generated from live placement, compliance and fill-rate data.
Sent on a schedule or manually. Without anyone compiling it.
Fill rates, time-to-fill, compliance status and placements by site. A more professional report, more often.
Report2Excel for clients who want the numbers in their own spreadsheet. Live, no licence needed.
Matters most to Account managers & clients
Case study · Enterprise Recruitment
One platform instead of a core product plus five or six integrations
Every office reporting from the same records rather than its own
Labour hire and permanent placement, reported side by side
Third-party analytics, rostering and signing tools switched off
Client reporting that once meant collating several sources by hand now comes out quickly and accurately, and margin is visible across multiple cost types for the first time. Read the Enterprise Recruitment story
What changes
Some agencies find out how the month went when it’s over. Ones that run on Tracker know while there’s still time to act.
Placements, margin and client activity used to mean exporting from the ATS, the CRM and a payroll spreadsheet. Now the division head opens one dashboard and sees them together.
Margin by client, consultant and month, built once in the report builder and delivered to the right inboxes every month without anyone touching it.
The managed service scorecard generates from live data, branded and client-ready, and goes out on a schedule.
Rising time-to-fill and slowing redeployment surface while there’s still time to change the outcome.
A source report run for the first time shows 40% of the quarter’s placements came from candidates already in Tracker. Stop paying to find candidates you already have.
Commission calculates from actual placement and invoice data, and the recruiter can see the math behind his own number.
In their words
The number, without the spreadsheet
Tracker works really well with automated daily KPI reports and custom dashboards that suit our needs.
The conversation then becomes more about the job and what you’re doing, and less about how many CVs have you sent this week. It becomes much more coaching.
Tracker works really well with automated daily KPI reports and custom dashboards that suit our needs.
The conversation then becomes more about the job and what you’re doing, and less about how many CVs have you sent this week. It becomes much more coaching.
Tracker works really well with automated daily KPI reports and custom dashboards that suit our needs.
The conversation then becomes more about the job and what you’re doing, and less about how many CVs have you sent this week. It becomes much more coaching.
Tracker works really well with automated daily KPI reports and custom dashboards that suit our needs.
The conversation then becomes more about the job and what you’re doing, and less about how many CVs have you sent this week. It becomes much more coaching.
Customized reports have allowed us to gain a better understanding of the whole company and each individual’s performance. Individual dashboards are also customizable, which is a big plus for us.
Everyone has just a daily look at how things are going. It’s one of the biggest things I’d say we utilize.
Customized reports have allowed us to gain a better understanding of the whole company and each individual’s performance. Individual dashboards are also customizable, which is a big plus for us.
Everyone has just a daily look at how things are going. It’s one of the biggest things I’d say we utilize.
Customized reports have allowed us to gain a better understanding of the whole company and each individual’s performance. Individual dashboards are also customizable, which is a big plus for us.
Everyone has just a daily look at how things are going. It’s one of the biggest things I’d say we utilize.
Customized reports have allowed us to gain a better understanding of the whole company and each individual’s performance. Individual dashboards are also customizable, which is a big plus for us.
Everyone has just a daily look at how things are going. It’s one of the biggest things I’d say we utilize.
See it for yourself
Bring the report you rebuild every Thursday
Book a 30-minute demo, tell us the numbers your team keeps compiling by hand, and we’ll build the dashboard live.
FAQ
Reporting questions, answered
Recruitment analytics and reporting software turns the records an agency already holds, candidates, jobs, submissions, placements, timesheets and invoices, into dashboards and reports. In Tracker it covers unlimited dashboards, a custom report builder, scheduled and client-facing reports, Lifecycle Charts, temp analytics and automatic commission reporting, all on the same live records.
Whatever the person looking at it needs. Tracker’s dashboards are built from a library of 50+ standard widgets, KPIs and custom reports, such as fill rates, pipeline health, margin and time-to-fill, with smart filtering by individual, team, department, date range or geo-location. You can build as many as you need, and Big Screen dashboards put them on the office wall in real time.
Yes. Dashboards and reports read the same records your team works in, so there’s no overnight refresh and no export step between the work happening and the number changing.
Yes. The custom report builder uses any field in Tracker, in summary, matrix or trend formats, and exports to Excel, CSV, PDF or PNG. Report2Excel feeds live data straight into Microsoft Excel spreadsheets without needing a Tracker licence.
Yes. Any report can be delivered daily, weekly or monthly to any team member’s inbox, or any client’s. Client-facing reports and scorecards are branded and generated from live placement, compliance and fill-rate data.
Yes. Commission calculates automatically across jobs, placements, temps and invoices, with flat or tiered banding, from actual placement and invoice data. Consultants can see the math behind their own number.
Yes. Redeployment rate, worker utilization, average assignment length, fill rate by client and margin per active assignment are tracked in real time across the whole active workforce.
A report builder you talk to. Type or dictate what you want in plain English and Tracker builds the report live, across jobs, candidates, placements, companies, activities, marketing, financials, timesheets and users. You can say how it should be displayed, refine it by editing the prompt, and save it like any other report.